Current Research
The Performance of East Pacific Easterly Wave (EPEW) Track Density in the UFS
Date: 2025
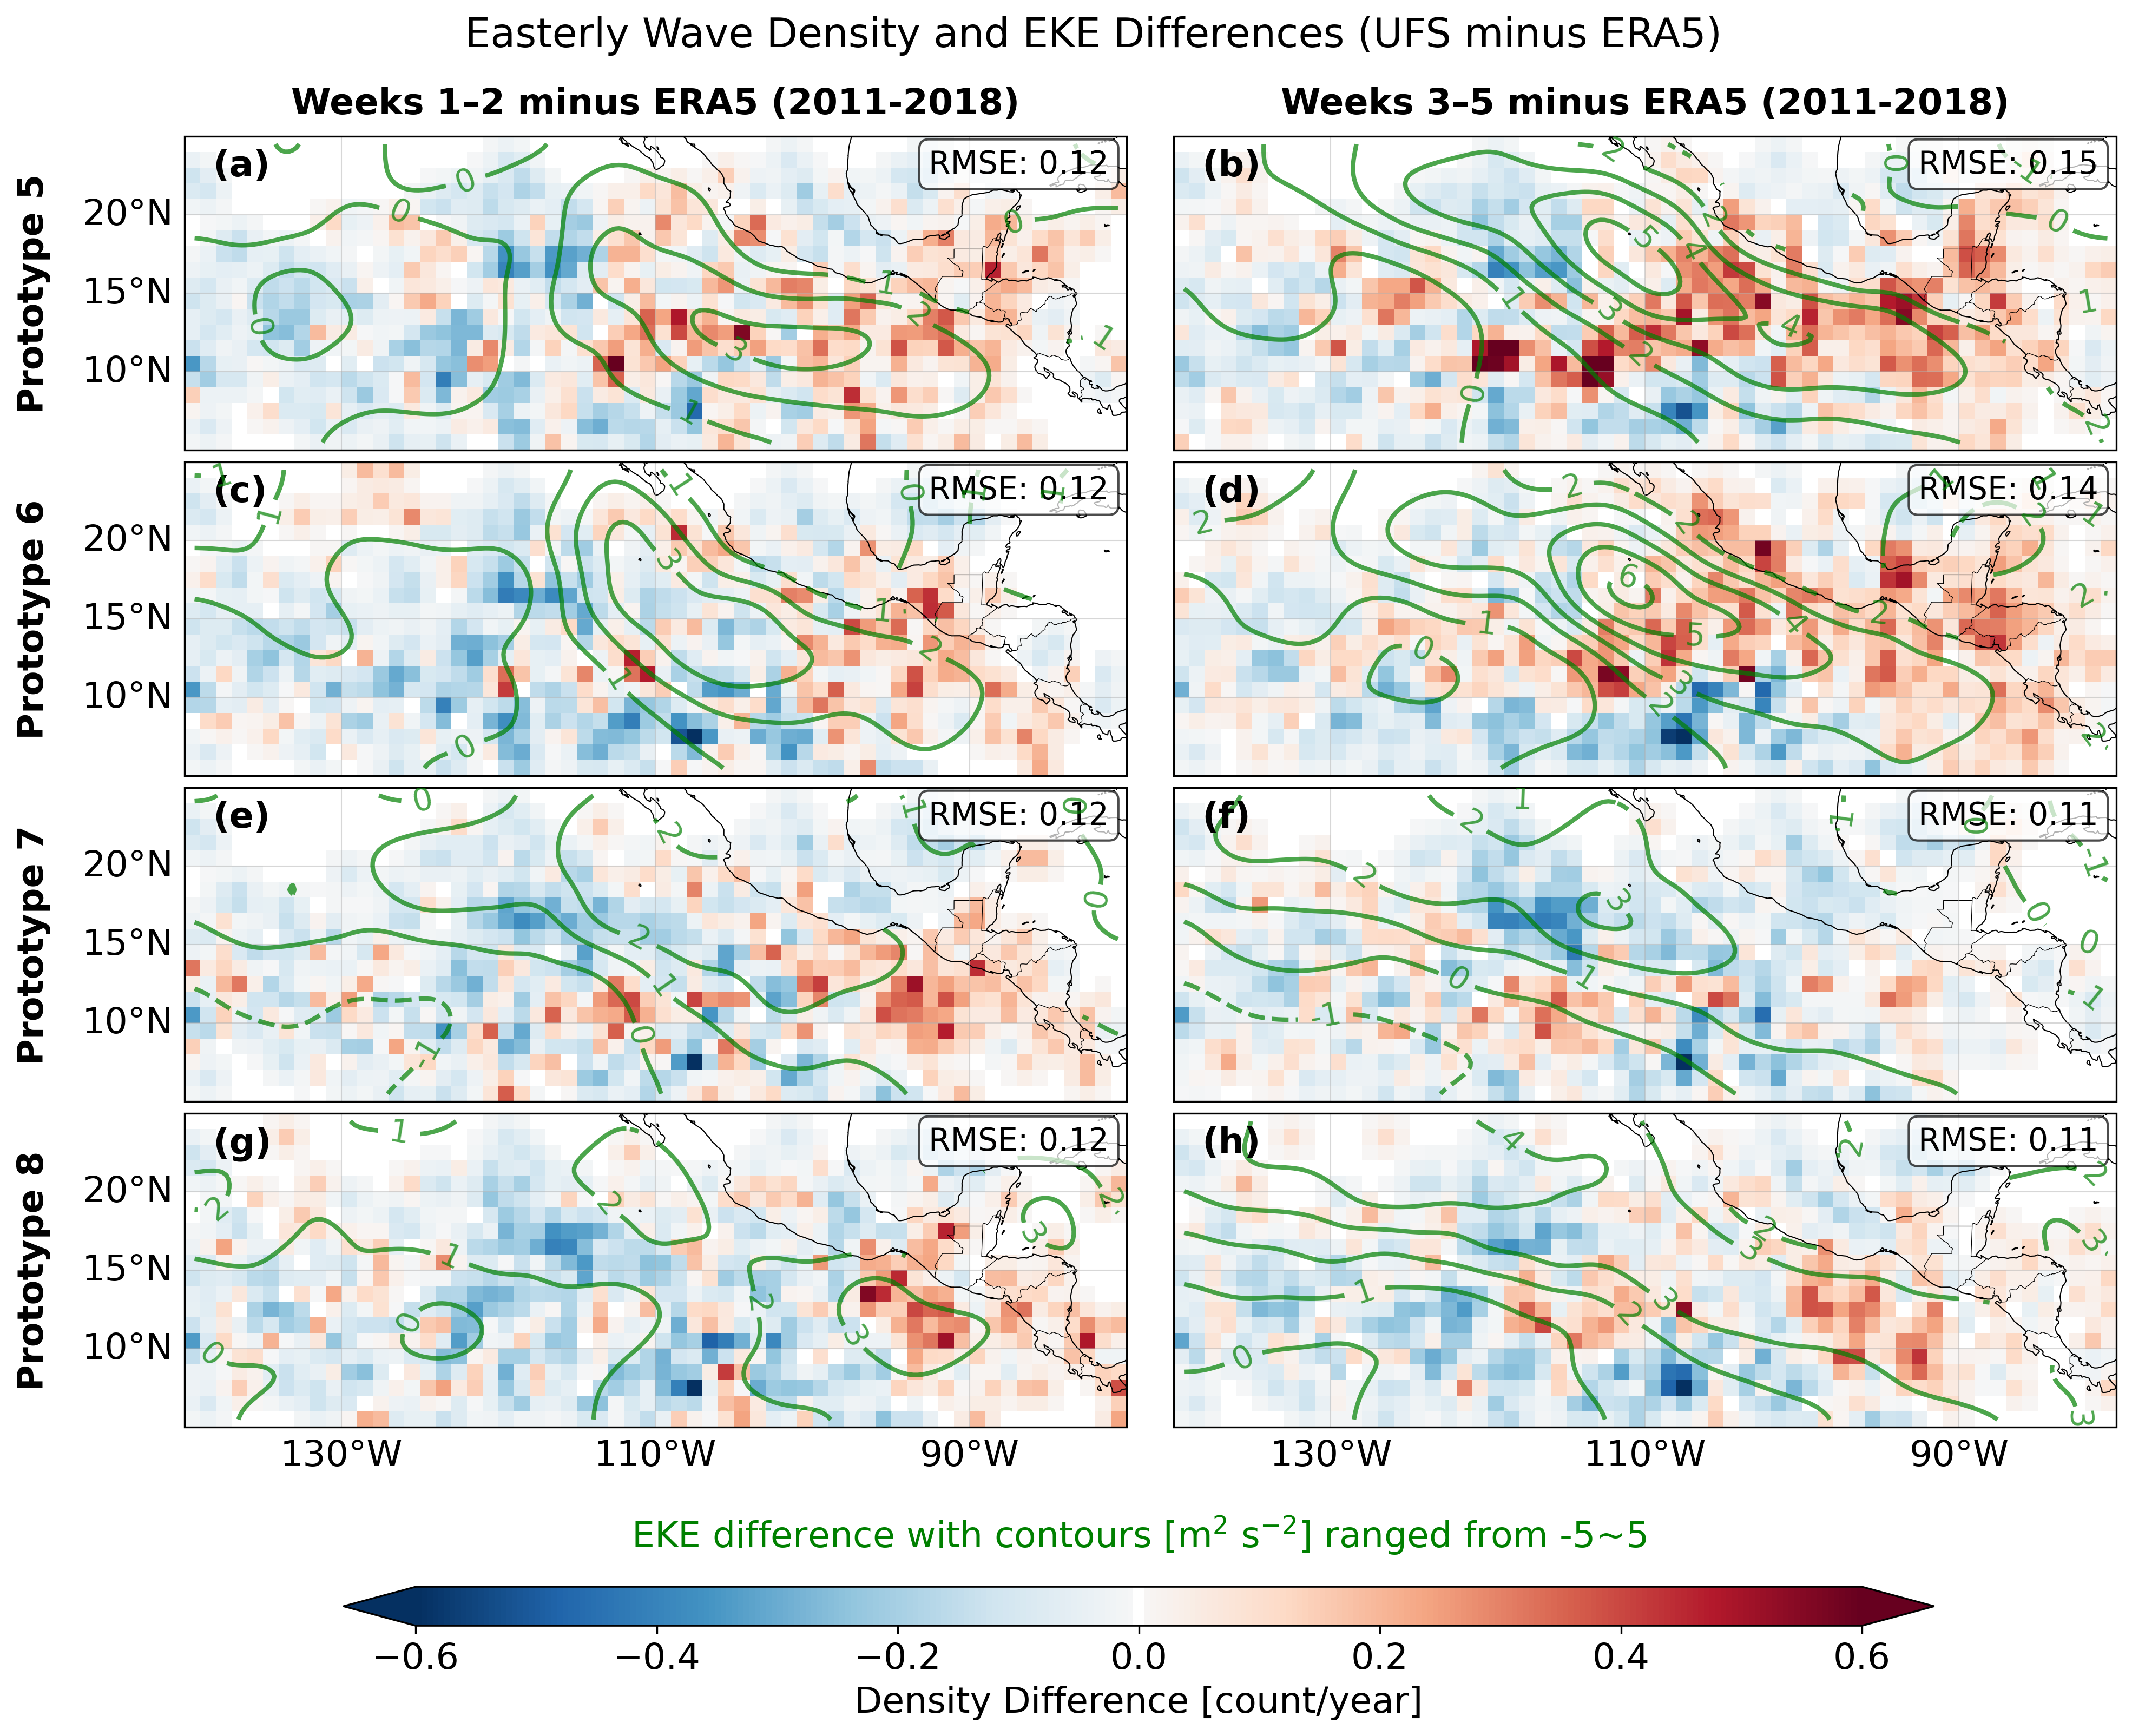
This figure highlights the link between these track density biases and errors in the EKE. During weeks 1–2, positive density differences are generally co-located with regions of enhanced EKE, particularly in the main EPEW genesis band around 10°–15°N. At longer leads, the magnitude and spatial extent of these biases increase. Prototypes 5 and 6 show especially strong positive anomalies along the Mexican coast and further west, whereas Prototypes 7 and 8 feature weaker and more spatially scattered differences. The root mean square error (RMSE), annotated in each panel, highlights the magnitude of these biases. Overall, while the UFS Prototypes can replicate the gross spatial pattern of EW activity in the EP, key quantitative and structural biases occur. These biases indicate differences between the UFS Prototypes and ERA5 in both EPEW frequency and spatial distribution, with the magnitude of these differences varying across Prototypes and generally increasing with forecast lead time.